Skip to content

What is a Decision Support System?

A decision support system (DSS) is an information system that supports business or organizational decision-making activities. This specific DSS of the Risk and Resilience Portal
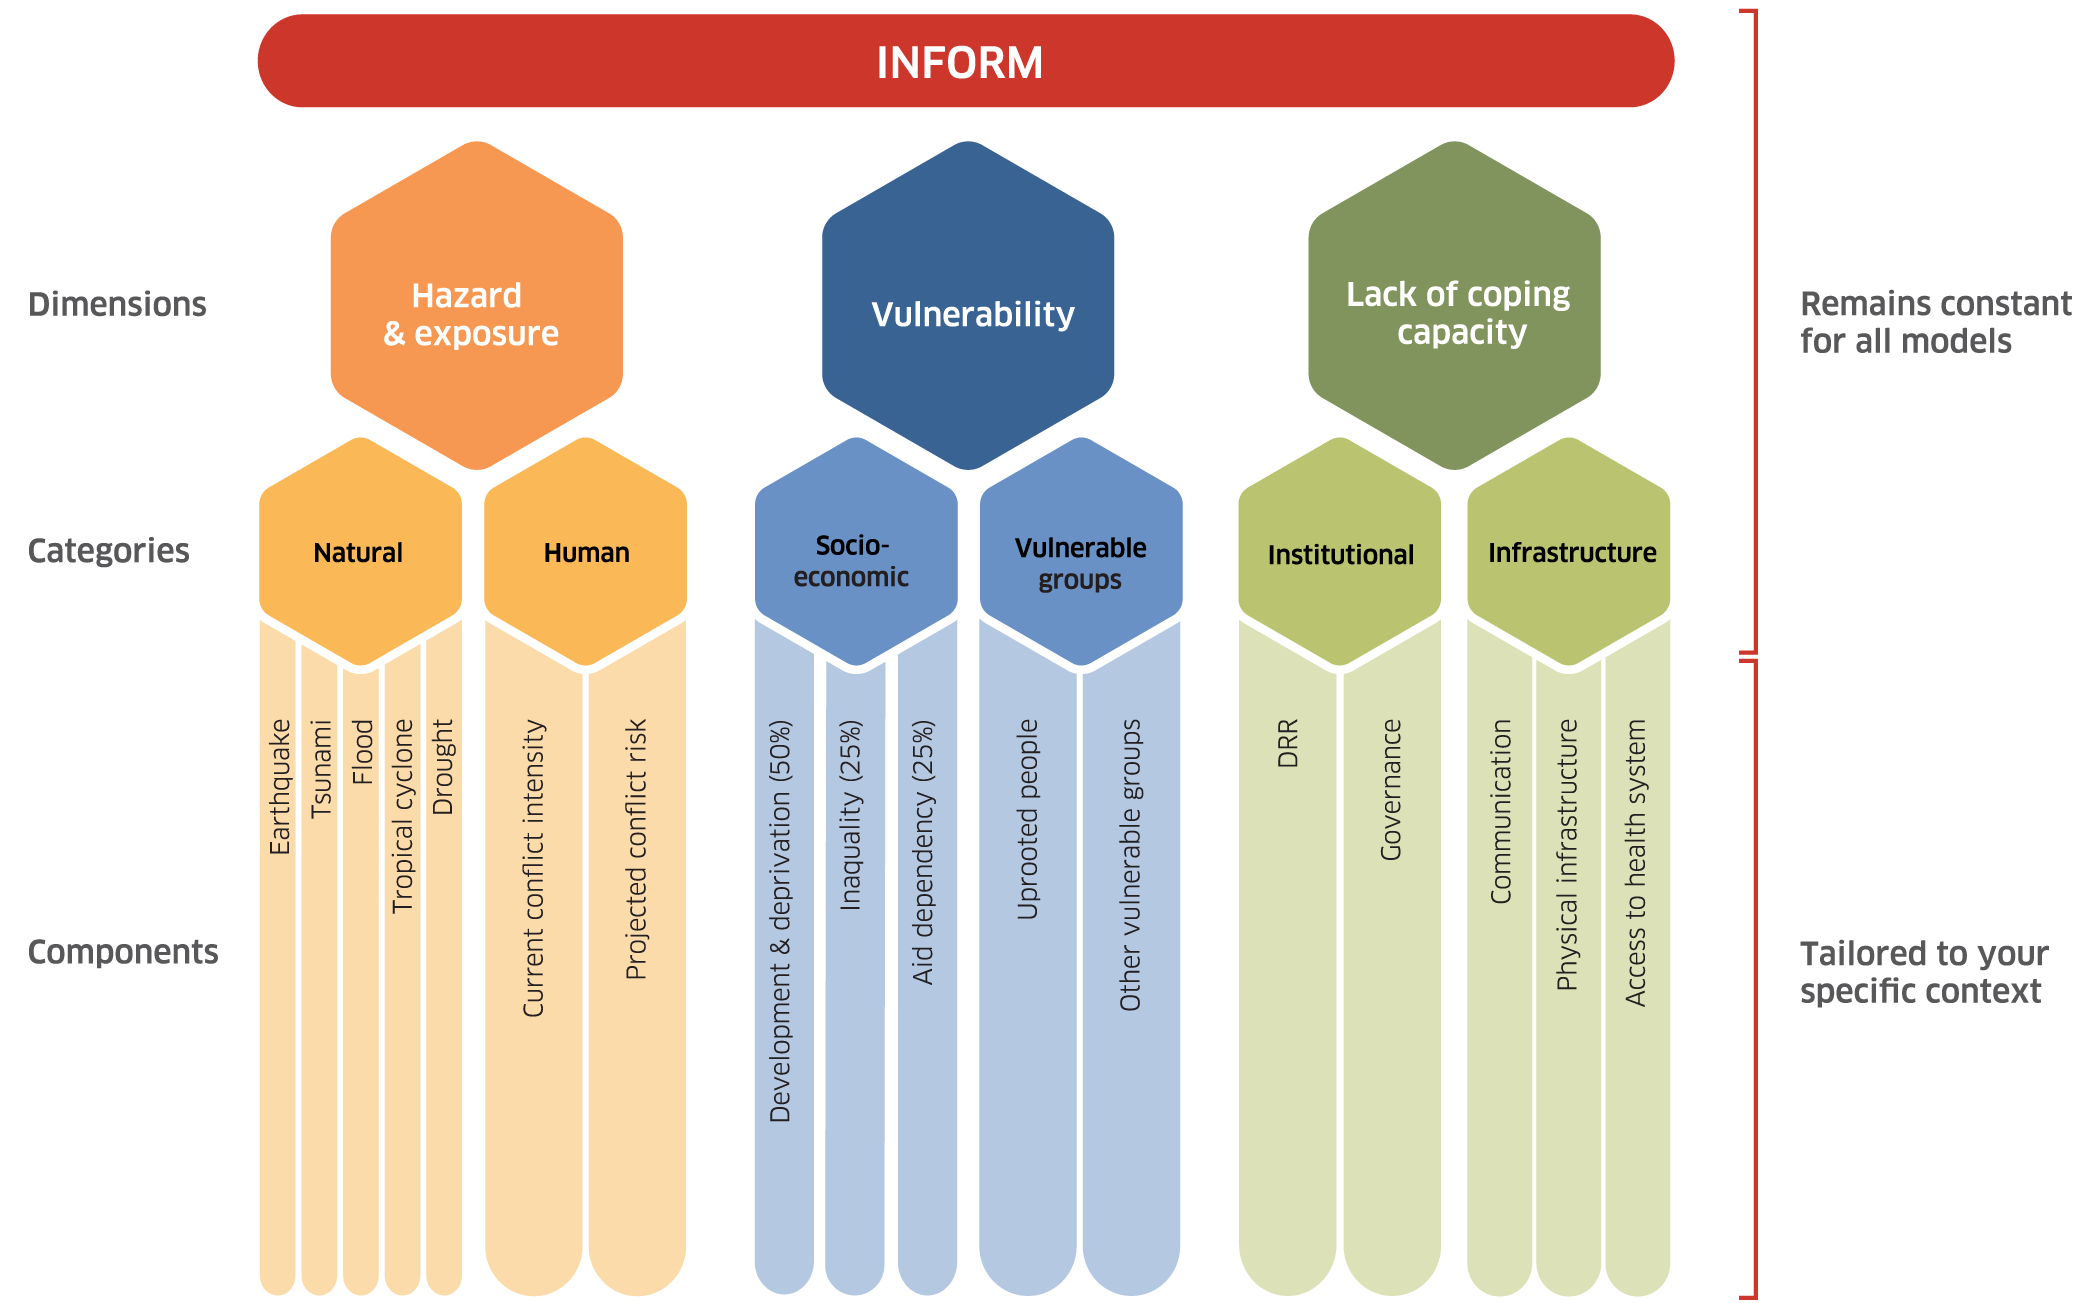
 can perform contextual analysis of variety of hazard, risk and vulnerability data, historical disaster losses, socio-economic information and present the output by indicators in an intuitive manner. All this complex analysis is not exposed to the users, so the users can just focus on the output of DSS and facilitate informed decision making. This DSS uses sub-national INFORM Risk Index methodology to generate key decision-making indicators. Below are some salient features of the tool,

INFORM Sub-National Risk Index

The analytics system of the DSS utilises composite indicator-based approaches to simplify output generated from scientific information. Complex geospatial analysis and composite indicator development happens under the hood which is not exposed to the users. So, our target users' policy and decision makers can just focus on the insights to steer informed actions. But for easy customization and future scaling we have utilized opensource methodologies (like sub-national INFORM Index) to create composite indicators. We are also providing data quality assessment so the decision makers can also understand how reliable the source data is.

The DSS analytic system employs sub-national INFORM model to process scientific, modelled, and socio-economic data sets to generate risk indices. INFORM includes three dimensions and six categories that remain same across countries, while components, sub-components, and indicators are expected to be adapted according to the context and data availability at subnational level. The analytics focus was kept on natural and health related hazards same as all other tools of the risk and resilience portal.

Subnational Conceptual Framework 2016
Source: https://ec.europa.eu/jrc/en/scientific-tool/index-risk-management-inform

For more information and to download the fourth report of the revised INFORM’s concept and methodology, access INFORM - Global, open-source risk assessment for humanitarian crises and disasters (europa.eu)

Data Quality Assessment (DQA)

The INFORM Risk Index uses secondary data available from multiple sources, including government departments from the five target countries, international organisations, academia, and non-governmental organisations. Each component of INFORM can have one or more indicators. For Myanmar, for example, 44 indicators were used in total. Assessing the quality of the data is key to produce a reliable analysis from the DSS, by examining what each dataset contains, where, when, and how it was created. Therefore, for each country the data was accessed based on four criteria:

  1. Availability
  2. Completeness [Granularity & Coverage (applicable for spatial data only)]
  3. Timeliness
  4. Reliability
Each criterion is calculated within a 0-100 range. The total DQA Index is the sum of the weighted value of each criterion. The calculation of the final DQA Score varies according to the type of data, as following:

DQA Methodology

Use the interactive Data Quality Assessment Dashboard below to explore the data used for all indicators across the five target countries, including data quality score, data sources, date, and description of indicators.

FAQ

What can I do in this DSS?

    You can visualize the INFORM Risk and other information for each administrative unit.
    You can compare the risk and other information of up to 2 or 3 administrative units.
    You can select administrative units (all or a few) and rank by INFORM Risk or by dimension (Exposure to Hazard, Vulnerability, and Lack of Coping Capacity).
    You can download INFORM Risk Index data (indicators, metadata, and calculation results) for more complex analysis.

How can I use the DSS? What is INFORM Risk Index?

    Please explore the video and download the report about the INFORM Risk Index to learn more about the methodology. To learn more about how to use the DSS you can press anytime the “?” button and see the quick explanation for each function. Also, you can press the ”i” icon next to each function for tips on how to use it.

Can I trust the data used in the INFORM Risk Index for my country?

    INFORM Risk Index uses secondary data sources from multiple sources. Project team has undertaken a comprehensive data quality assessment to guarantee the data used is from reliable sources. For each country we have accessed the quality of the data in terms of availability, reliability, timeliness, and completeness. Each indicator data received a final score based on the 4 criteria and only those who have the highest scores were included. For each country around 65 to 85 indicators were analysed. Approximately 35% to 45% passed the minimum criteria and were included in the INFORM Risk Index for each country. Most data sources used were latest Census data publicly available at the target administrative level, latest Demographic and Health Survey (DHS) data, and analytical products by international organizations. For a comprehensive view of the Data Quality Assessment results and criteria, please explore the Data Quality Assessment Section above.

How recent was the data used for INFORM Risk Index?

    As in 2021, we aimed to use the most recent data available for each indicator. However, data availability varied across the target countries according to the latest census data available, for example. To see the data source and date of each indicator, access the Data Quality Assessment Interactive panel in the section above or download the data for your country.

Which hardware and software were used in this DSS?

    The DSS was developed using ArcGIS API for JavaScript as a based development together with ArcGIS Enterprise. The application is hosted at CERN cloud infrastructure.

I want to do more complex analysis with the data, what can I do?

    You can click on the "Download" button to access the indicators data as well as the INFORM Risk Index calculation for each country.

Should I base my decisions exclusively on the results of DSS?

    No. The DSS is a supporting tool for decision-makers, not a substitute for the decisions. Decision processes are complex, involve multiple variables, rely on contextual knowledge, and should be participatory. We expect that the information provided by the subnational INFORM Risk Index – for example the RISK for different districts or townships – can be one objective input to contribute to prioritization and strategic planning for Disaster Risk Management.

I feel the lack of coping capacity of my area does not accurately describes what is happening in the ground. What can I do?

    The INFORM Risk Index was calculated based on the indicators with current reliable available data. Proxy indicators were used as needed to address the data gaps, for example to measure institutional capacity for DRR in the subnational level. This can be an opportunity within your jurisdiction to discuss the need to have regular, reliable, and integrated data collection on the missing indicators – for example, to assess the coping capacity on DRR of local governments or the numbers of emergency shelters by administrative unit.

Why does my country not have a DSS?

    The five countries were selected based on the current resources available.

I would like to contact the team for feedback or suggestions, what can I do?

Disclaimer

The Decision Support System presents the INFORM risk index at the sub-national level, where users can easily recognise the relative risks of different administrative units. Easy-to-understand annotation on the INFORM scores is presented in this display. This analytics is based on preliminary sub-national INFORM index developed by the United Nations Satellite Centre (UNOSAT) and the United Nations Economic and Social Commission for Asia and the Pacific (ESCAP). This composite indicator is yet to be validated and approved by responsible government ministry. Please use with caution.

The boundaries and names shown and the designations used on this map do not imply official endorsement or acceptance by the United Nations. Dotted line represents approximately the Line of Control in Jammu and Kashmir agreed upon by India and Pakistan. The final status of Jammu and Kashmir has not yet been agreed upon by the parties.

This application was developed using: